About SQS Pro Signals Indicator
Trading SPY, QQQ & SPX Options


Unlock the power of the SQS Pro Signals Indicator, designed specifically for trading Options on
SPY, QQQ & SPX
SQS Pro undertakes all the monitoring of charts for you and sends you alerts you when you need to take a look and place a trade.
Experience real-time market monitoring capturing pre-market changes, opening ranges, candle breakout identification and provides a suggested strike price. Our advanced alerts system ensures you're always ready to make your move, boasting a 90+% success rate in identifying candle breakout direction.
An in-built back testing function allows for hypothetical scenario analysis, ensuring you're fully prepared for any market condition. Use two copies of the indicator on your chart to show AM and PM trade call-out results.
Test it out for FREE for a week before subscribing or buying.
Check the past results for yourself and watch it work to see how easy it is to use...........
Witness the power of SQS Pro Signals Indicator for trading Options on
SPY, QQQ & SPX
Trading Options can be a risky business with high volatility, market moves, FED announcements to name but a few.
Are you trading Option too much, in/out of trades through the day? Yes/No
Do you have a Fear of Missing Out (FOMO)? Yes/No
Do you capture ALL of the Options trades you make? Yes/No
Do you have a Trading Plan? Yes/No
Do you stick to your plan 100% of the time? Yes/No
If you have answered No to any of the above questions then Sign Up for a FREE 7 Day trial of SQS Pro Signals and see what you have been missing........ No cash to pay at all, well for a week anyway!!
Test it out for FREE for a week before subscribing or buying.
Check the past results for yourself and watch it work to see how easy it is to use...........
SQS Pro Signals offers real-time market monitoring on SPY, QQQ, and SPX, identifies a candle breakout, provides a Strike Price.
Advanced alerts keep you informed of progress and incorporates a back testing function so you can test out your own strategy on past days trading.
Real-time Market Monitoring: The tool provides real-time monitoring of the market, including pre-market and opening ranges, to identify potential trading opportunities.
Candle Breakout Identification: It identifies candle breakout patterns, which are often used by traders to determine potential shifts in market direction.
Strike Price Suggestions: The tool suggests strike prices for options trading, helping traders make informed decisions about their trades.
Advanced Alerts System: Alerts are provided to notify traders when they should review charts and potentially place a trade, based on the identified patterns and conditions.
Visual Display: Information is displayed visually on charts, making it easier for traders to understand and act upon.
Back Testing Functionality: The tool includes a back testing function, allowing traders to analyze hypothetical scenarios and test their trading strategies under various market conditions.
It's important for traders to remember that while such tools can be helpful, trading always involves risk, and no tool can guarantee success. Additionally, it's essential to thoroughly understand how the tool works and to use it in conjunction with sound trading strategies and risk management techniques.
How do SQS Pro Signals help you?
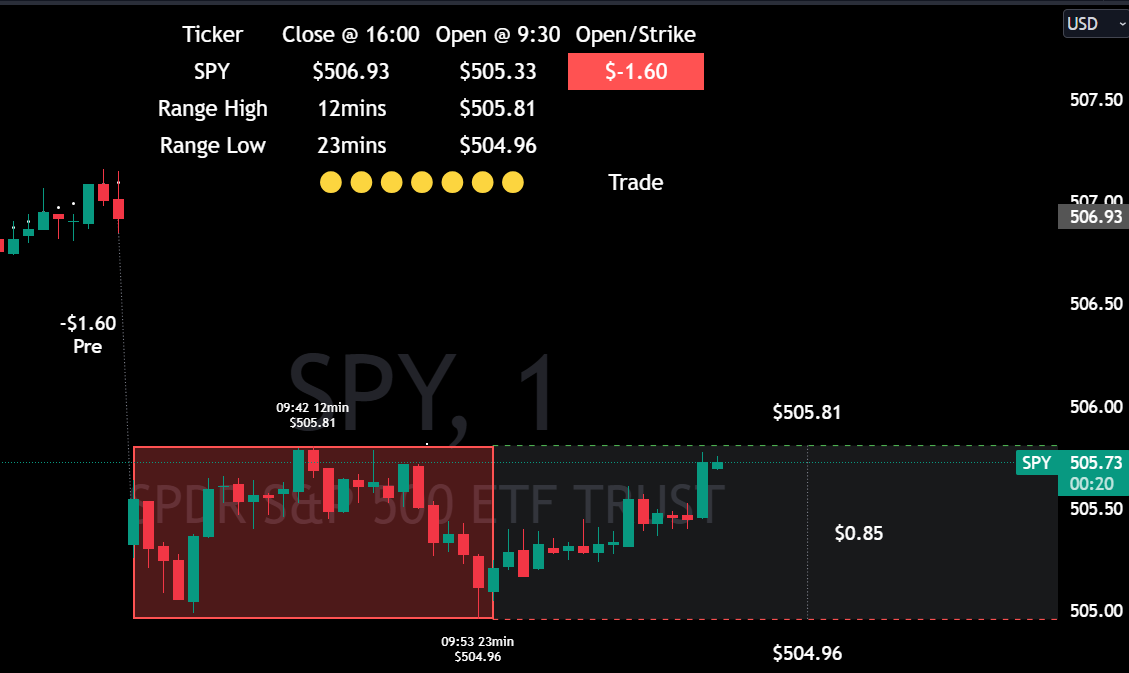
Stage 1 - Prior to / At Market Open
Pre Trade Movement
At market open the indicator starts to work and records the previous day close price and the opening price on the Summary Table. The difference is also shown and plotted on the chart.
As the candles open and close the dynamic Opening Range Box expands to show the price movement.
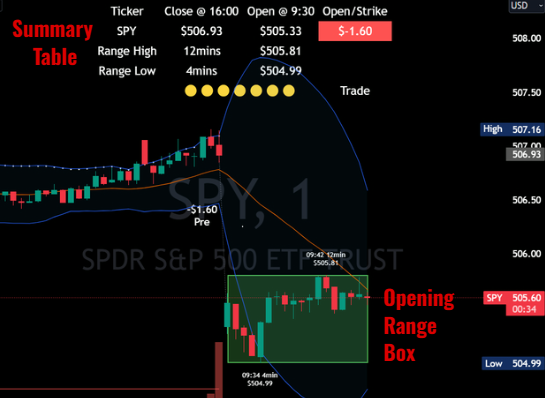
Stage 2 - After Market Open
Opening Range Box
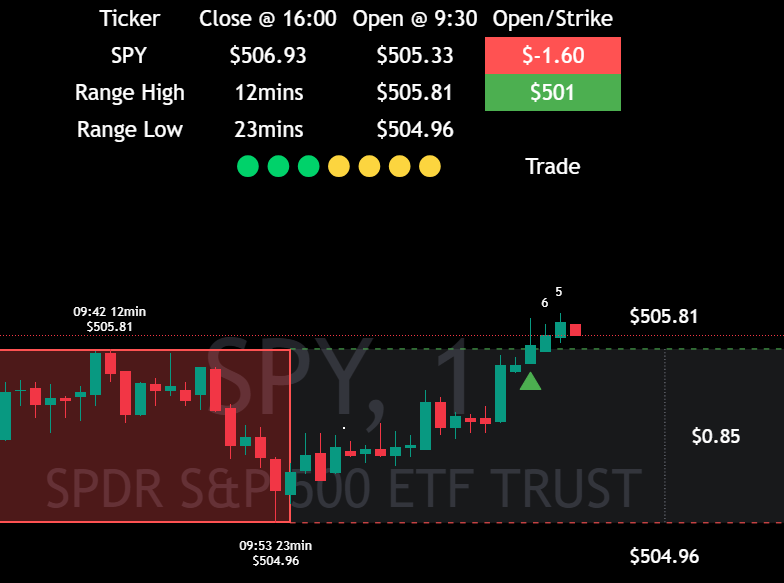
At market open SQS Pro Signals records the previous days close price, the new opening price and plots this showing the movement on the Summary Table.
As each of the candles open and close the dynamic Opening Range Box expands to show the price movement and the highs and lows also plotting the values on the chart.
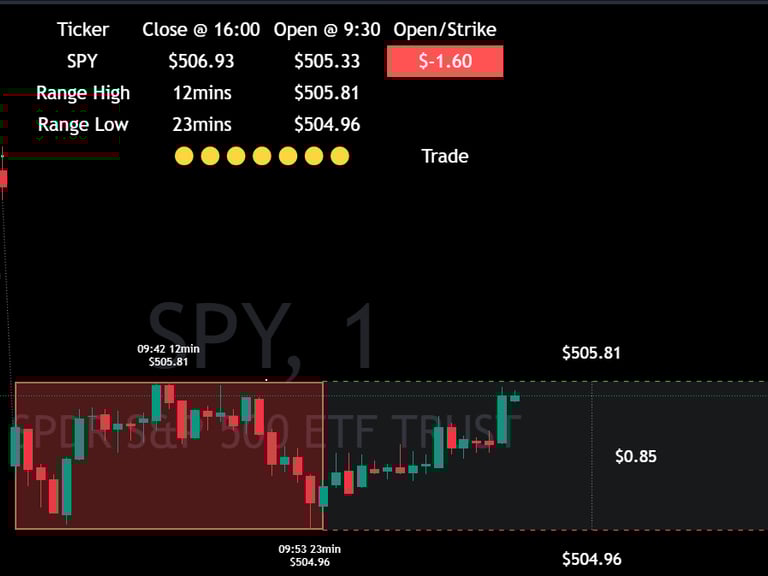
Stage 3 - Monitoring Candles for a Breakout
Identify Candle Breakout
At market open the indicator starts to work and records the previous day close price and the opening price on the Summary Table. The difference is also shown and plotted on the chart.
As the candles open and close the dynamic Opening Range Box expands to show the price movement.
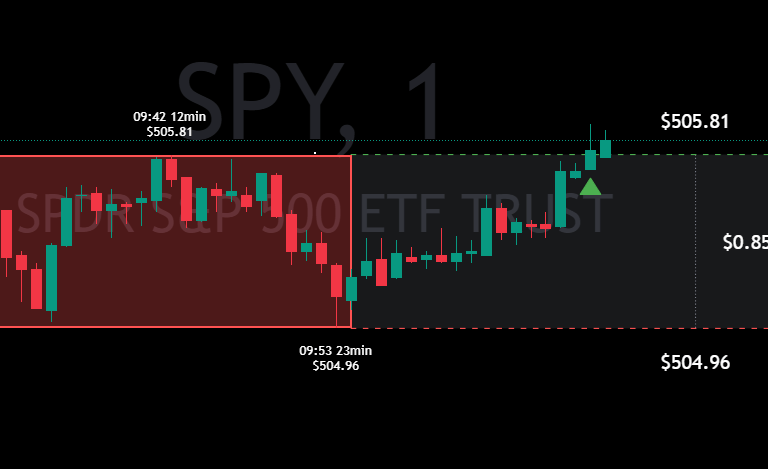
Stage 4 - Monitors Candles

Trade Countdown
At market open the indicator starts to work and records the previous day close price and the opening price on the Summary Table. The difference is also shown and plotted on the chart.
As the candles open and close the dynamic Opening Range Box expands to show the price movement.
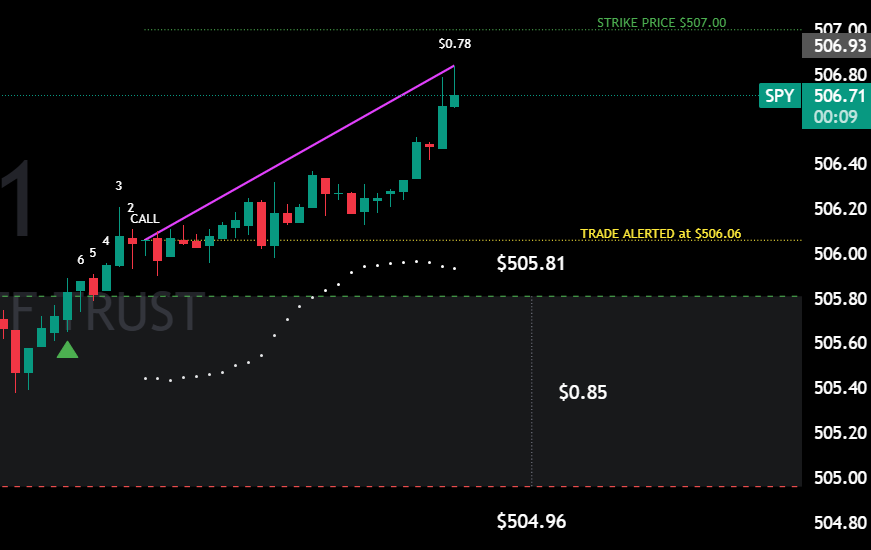
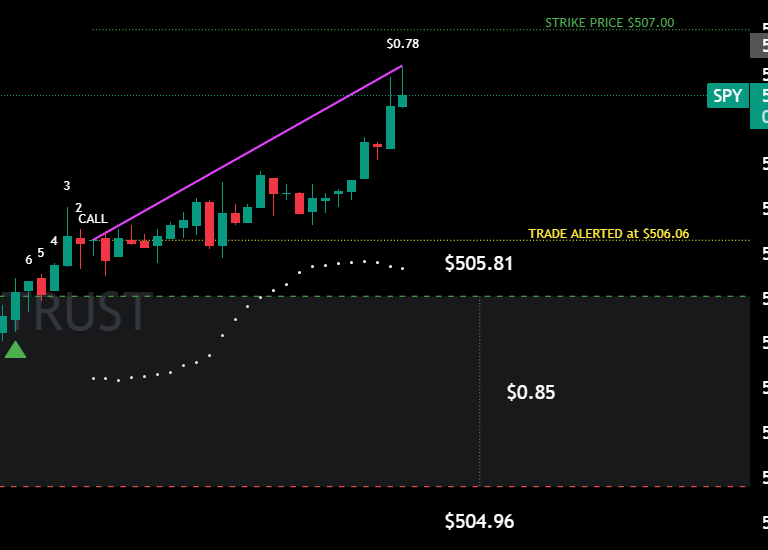
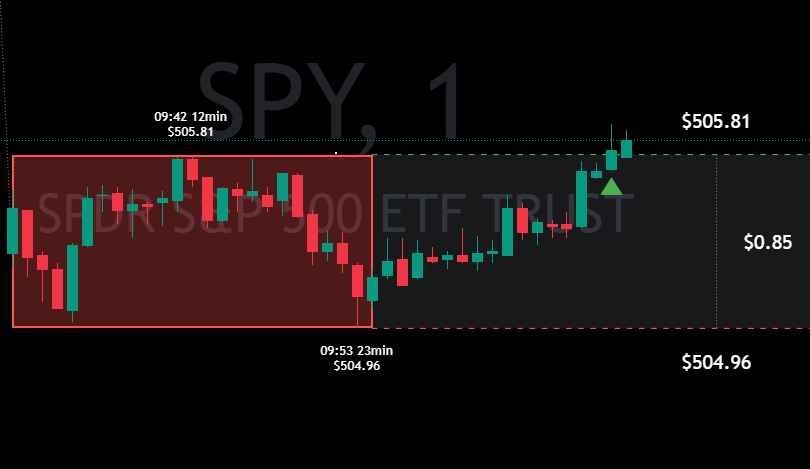
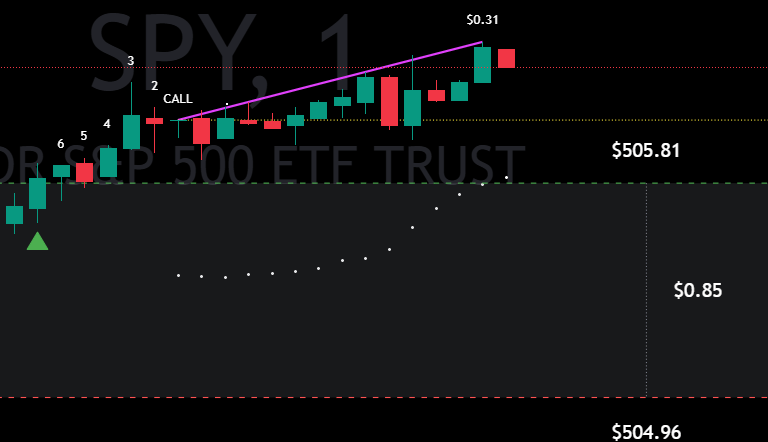
Stage 5 - The Trade
Trade Confirmed
This shows when the breakout to the upside is confirmed and 'CALL' is plotted above the candle, you can now place your trade.
As the candles move upwards a pivot line is drawn to show the highest gain and a dotted line is plotted which is the lower Bollinger Band for you to consider closing your trade if 3 candles close lower. Alerts will let you know when this happens.

Stage 6 - When in a Trade
Manage Your Trade
This part is up to you as I don't know what your trading plan is!!! Do you know?
There are settings for you to align to your own strategy, you can set up to 3 Take Profit levels and scale out of your profitable trades.
You must have your own strategy and stick to it. Make regular improvements but stick to your plan each day.
DO NOT OVERTRADE and keep your trades the same size each time.
DO NOT risk more than 10% of your cash portfolio on a single trade.
Regular and consistent profits will win the day for you every time.